Markers and Annotations
Overview
Markers let you annotate specific timestamps or time ranges on the chart. They persist in workspace files and are visible as overlays on both the main chart and the minimap.
Types
- Point marker: A single timestamp, shown as a vertical line with a triangle cap
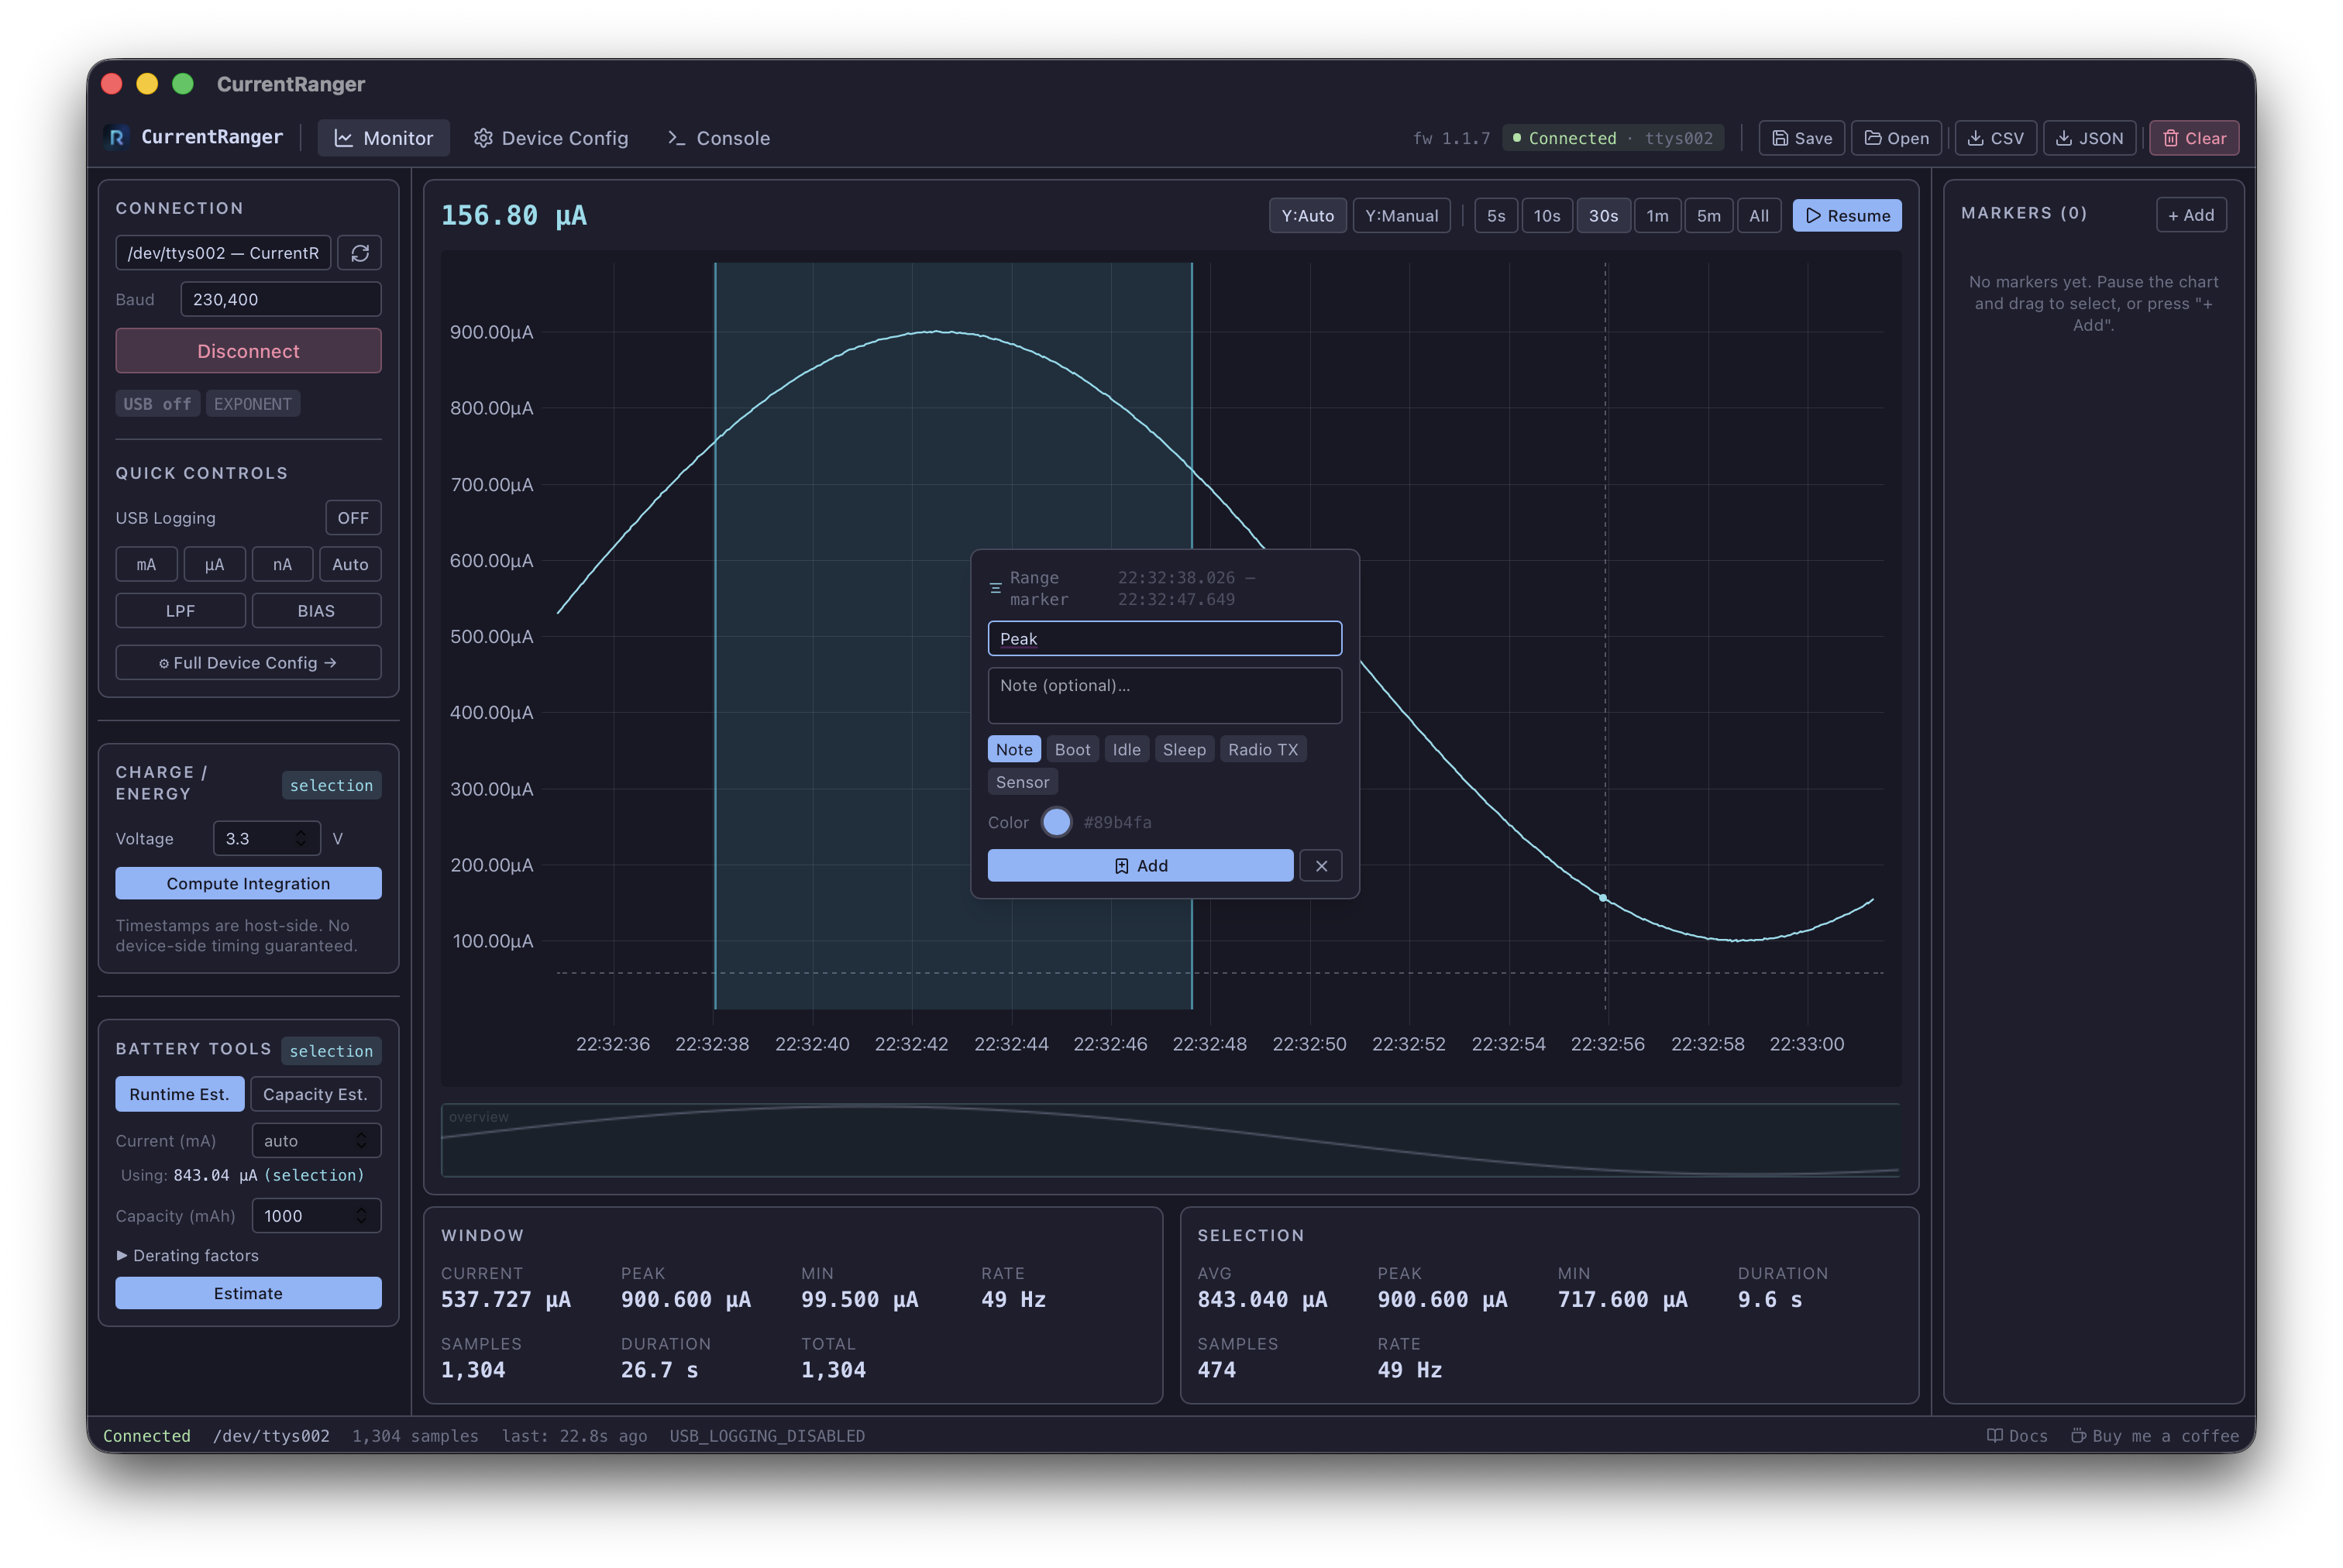
- Range marker: A start and end timestamp, shown as a translucent shaded region with dashed borders
Adding Markers
Right-click (context menu)
- Right-click on empty chart area: Opens a popup to add a new point marker at that timestamp
- Right-click inside a drag-selection: Opens a popup to add a range marker spanning the selection
- Right-click on an existing marker: Opens the edit popup for that marker
M key
Press M while hovering the chart to add a marker at the cursor position. If a drag-selection is active, it creates a range marker.
Markers Panel (+ Add)
Click + Add in the right sidebar to add a marker at the current time. Click again (Cancel) to close the add form.
Editing Markers
- Right-click on a marker in the chart to open the edit popup
- Click Edit on a marker row in the right panel
- You can change the label, note, category, and color
- Click the color circle to open the native color picker
Deleting Markers
Click the x button on a marker row in the right panel.
Navigating to Markers
Click any marker row in the right panel to jump the chart viewport to that marker’s timestamp. For range markers, the viewport spans the full range with some padding.
Validation
- The label field is required when adding or editing markers
- Attempting to save without a label shows a red validation error
Categories
| Category | Default Color |
|---|---|
| Note | Blue |
| Boot | Green |
| Idle | Cyan |
| Sleep | Purple |
| Radio TX | Orange |
| Sensor | Yellow |
| Custom | Pink |