Live Chart
Overview
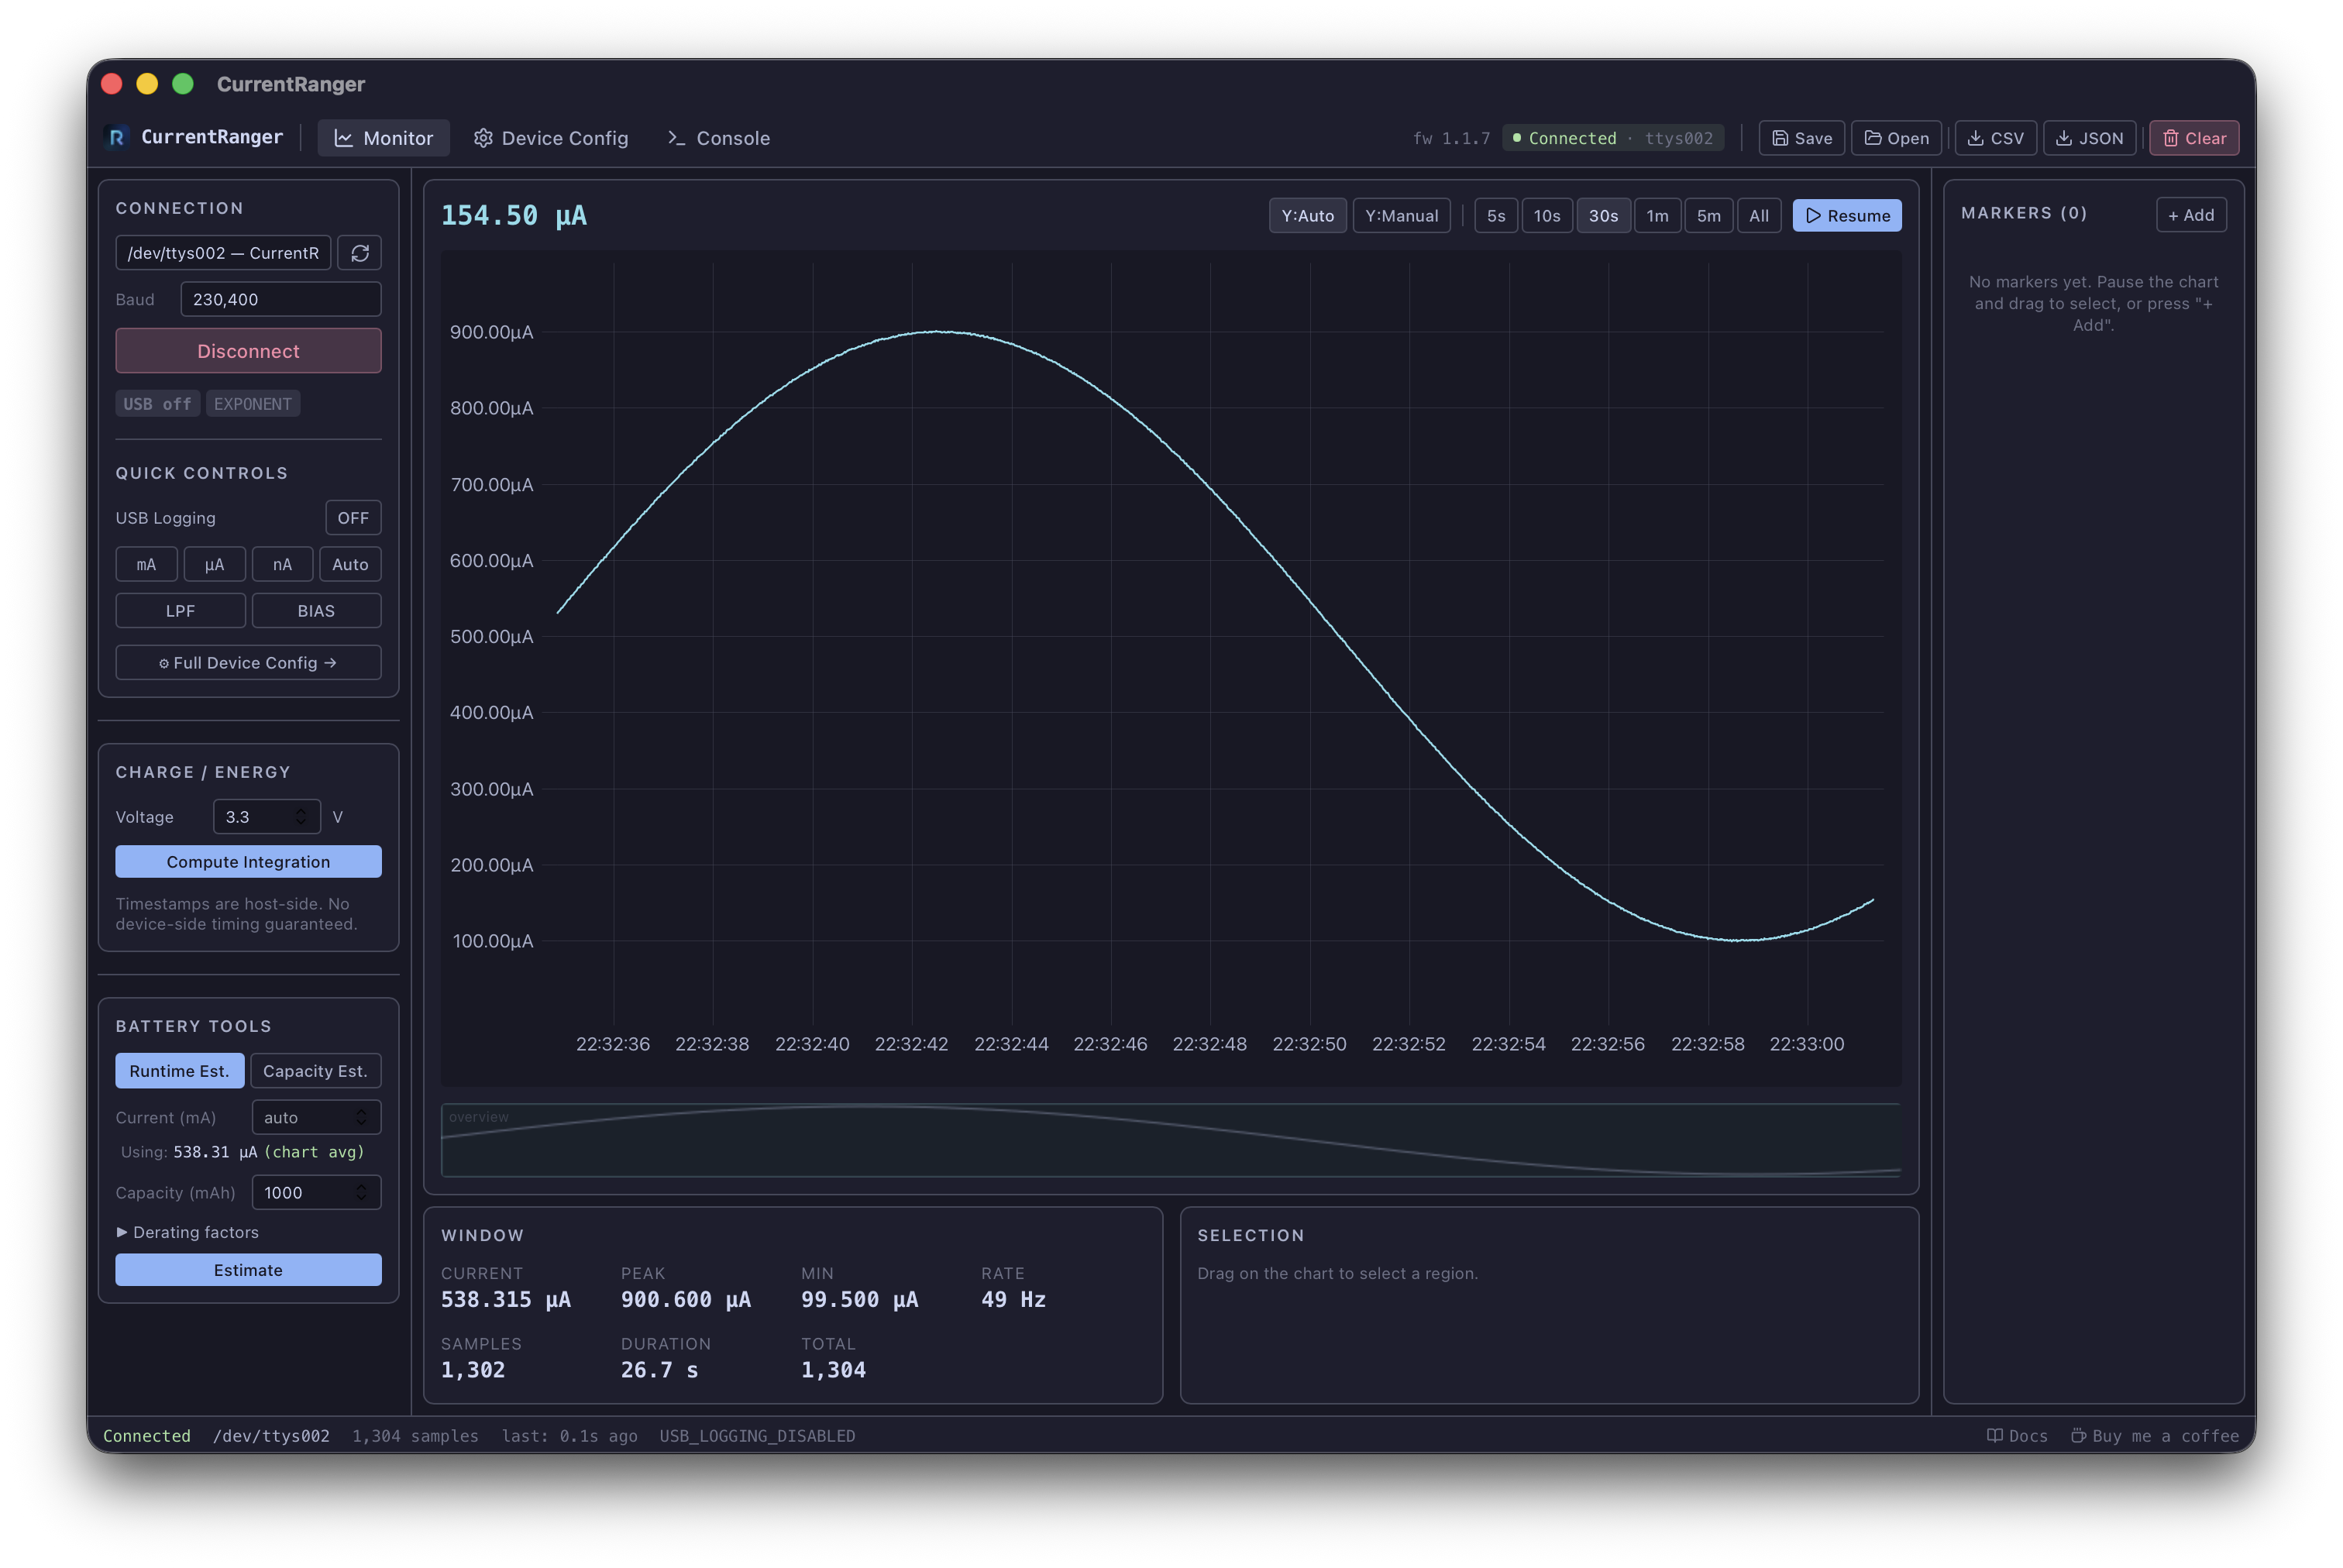
The live chart displays real-time current measurements using a high-performance uPlot renderer capable of displaying 500,000+ data points smoothly.
Toolbar
| Control | Description |
|---|---|
| Live value (top-left) | Shows the latest sample value when streaming, or the value under the cursor when paused |
| Y:Auto / Y:Manual | Toggle between automatic and manual Y-axis scaling |
| 5s, 10s, 30s, 1m, 5m, All | Time window selection |
| Pause / Resume | Pause data capture and enable exploration; resume to continue streaming |
Time Windows
Click a time window button to change the visible time range. When paused, the chart snaps to the most recent N seconds of data. When streaming, the chart auto-scrolls to show the latest window.
The All button shows the entire data buffer.
Pausing and Resuming
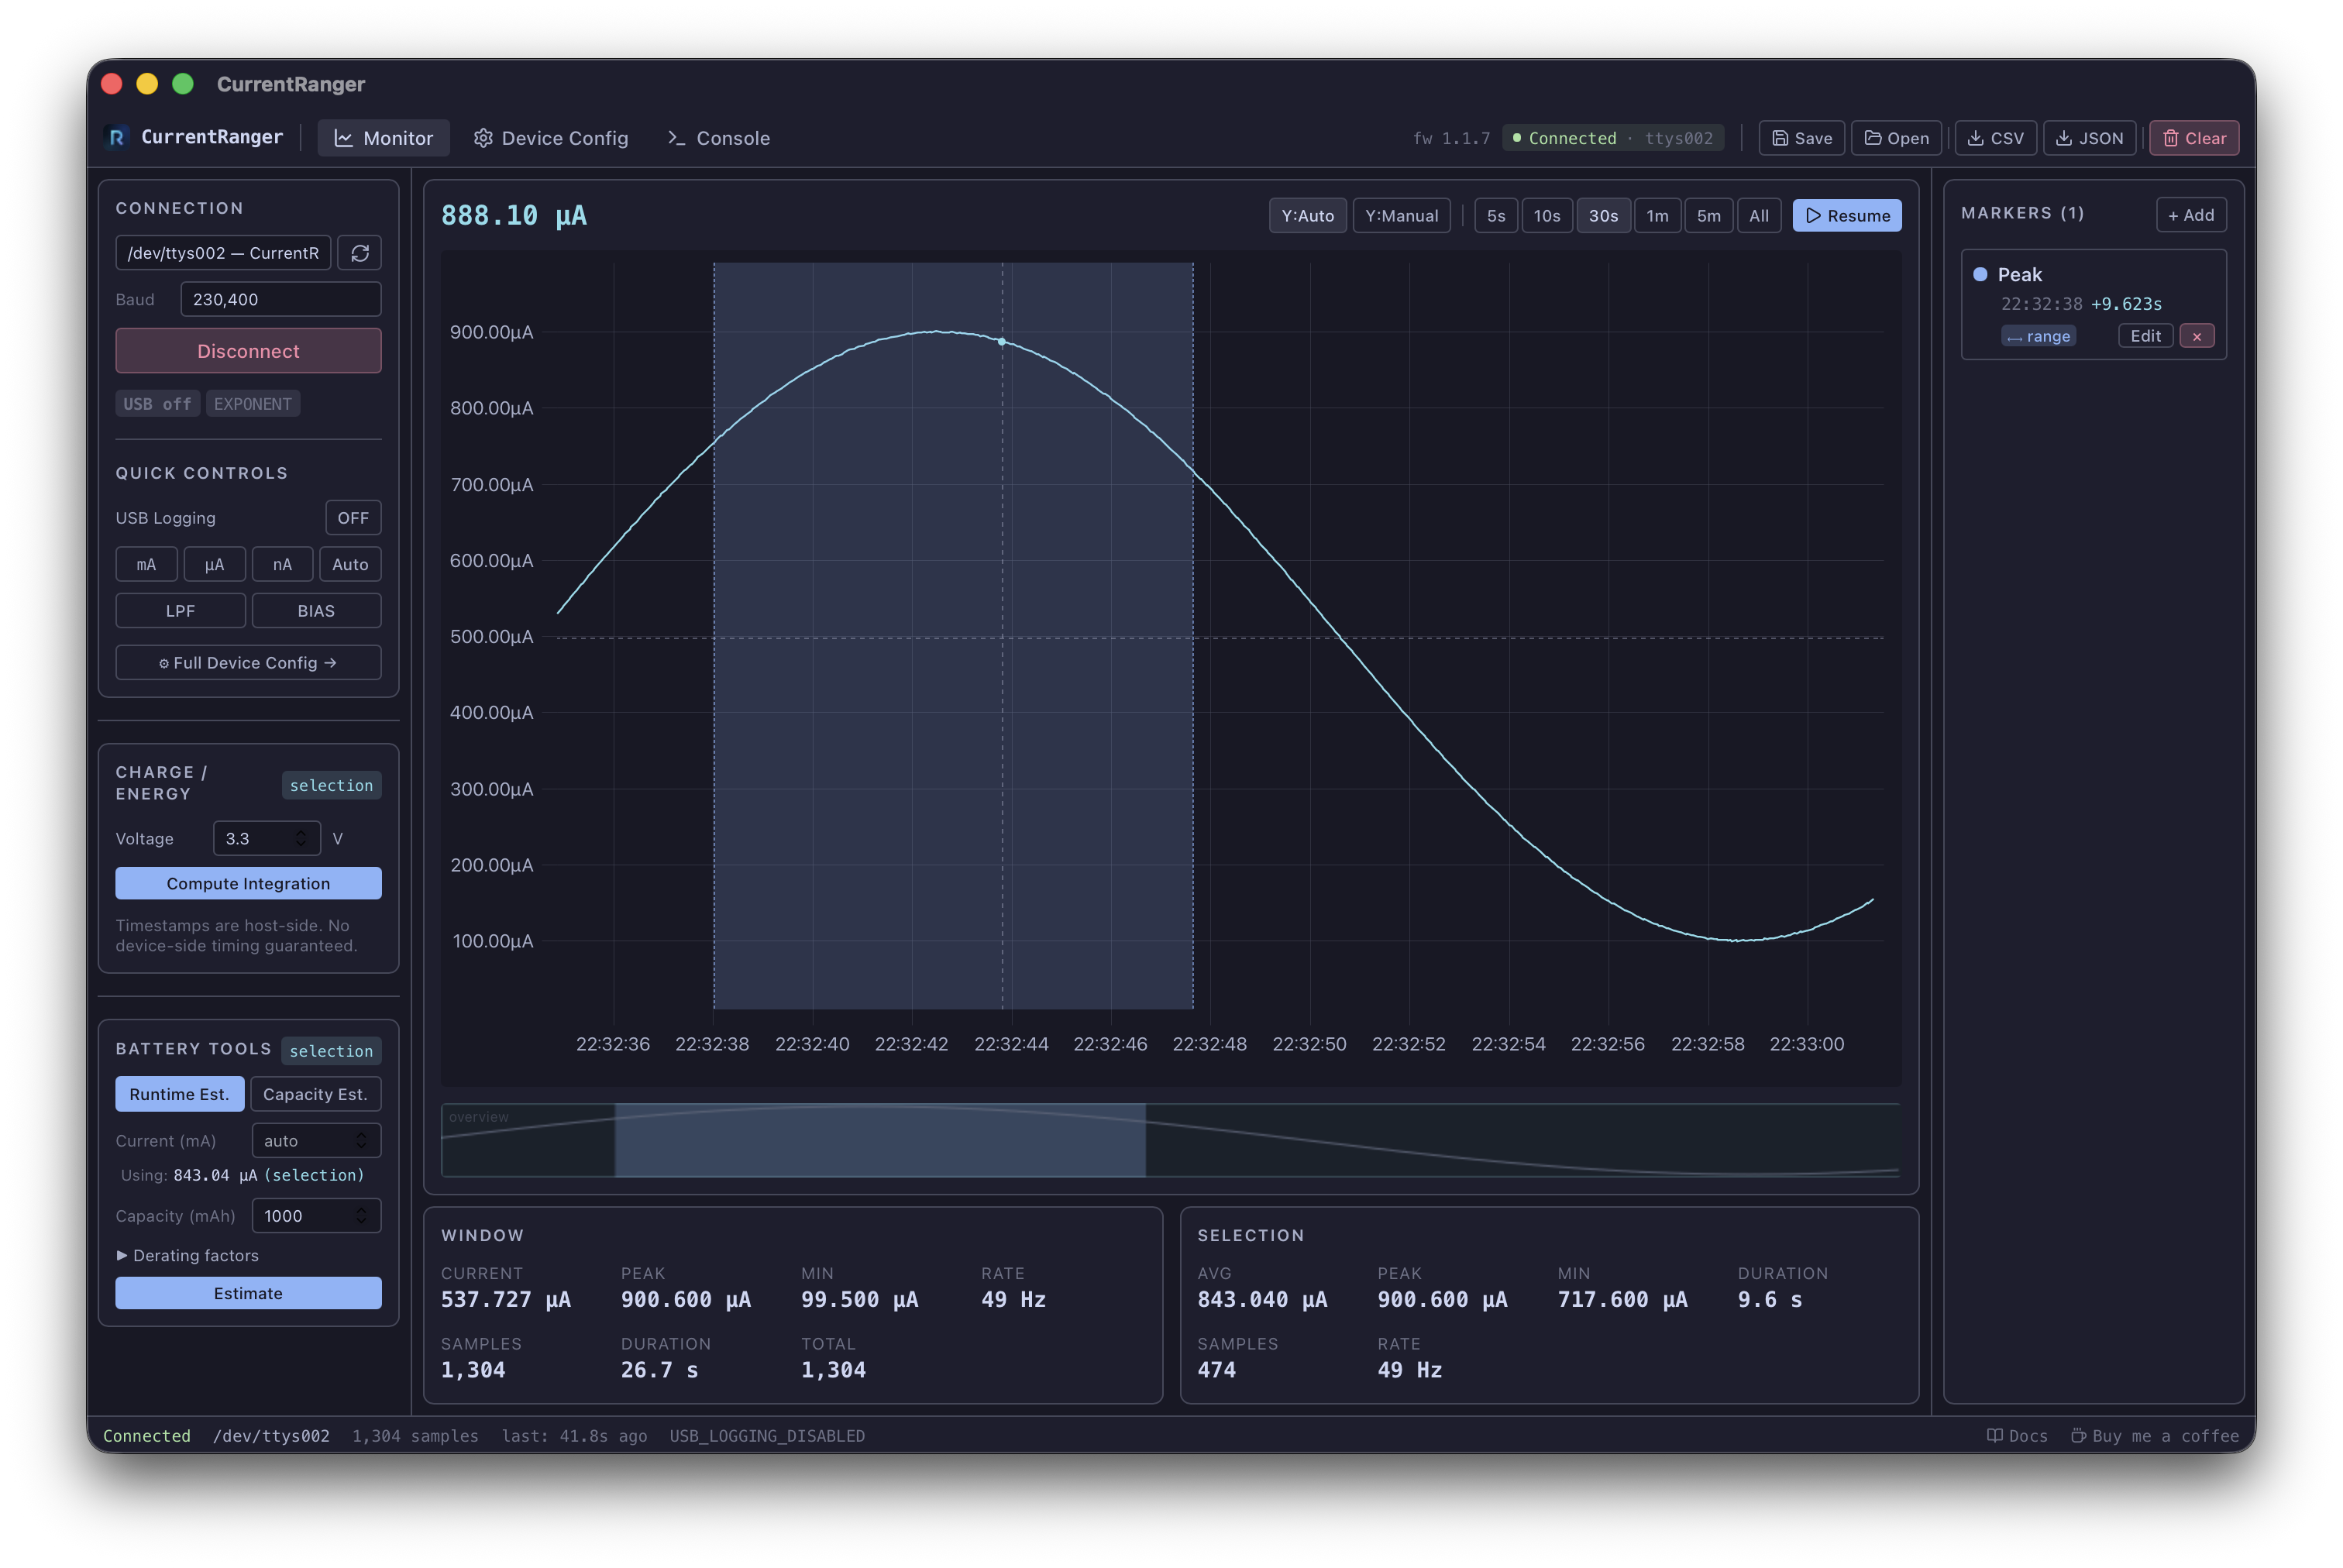
- Pause: Stops USB data logging on the device and freezes the chart. You can now scroll, zoom, and make selections.
- Resume: Re-enables USB logging and resumes live scrolling. Any active selection is cleared.
Scrolling and Navigation
When paused:
- Use the minimap (below the chart) to click or drag to any point in the data
- The chart viewport updates immediately with correct Y-axis scaling
- The minimap highlights the current viewport
Cursor Value
When paused, hovering the chart shows the nearest sample value in the top-left readout. This updates in real-time as you move the cursor.
Data Gaps
When USB logging is toggled off and back on, or when reconnecting, a line break is inserted so that separate acquisition sessions are not connected by a line.
Selecting a Range
Click and drag on the chart to select a time range. The Selection stats panel below the chart shows statistics for the selected region.
- Left-click on empty chart area clears the selection
- Left-click on a saved range marker loads that marker’s time range as the selection
- Changing the time window or resuming also clears the selection